
Chart Utilities
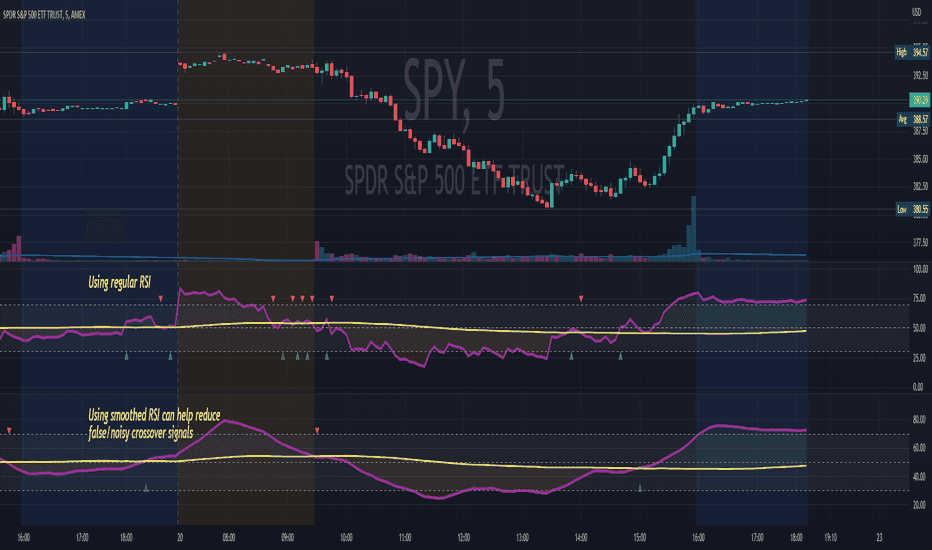
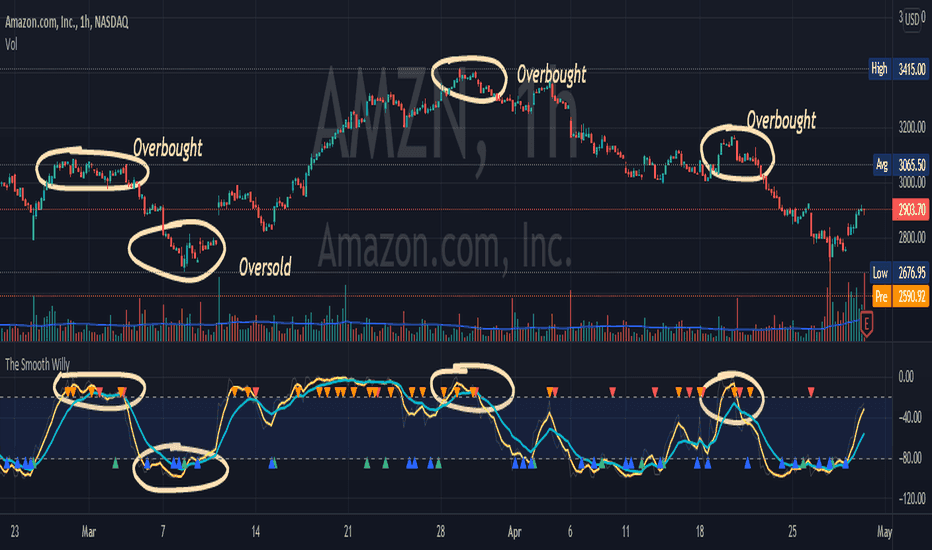
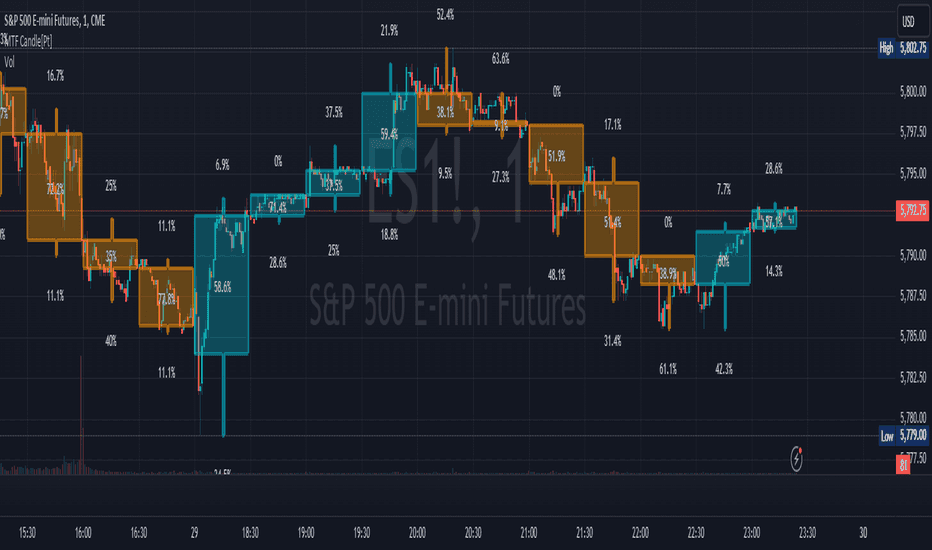
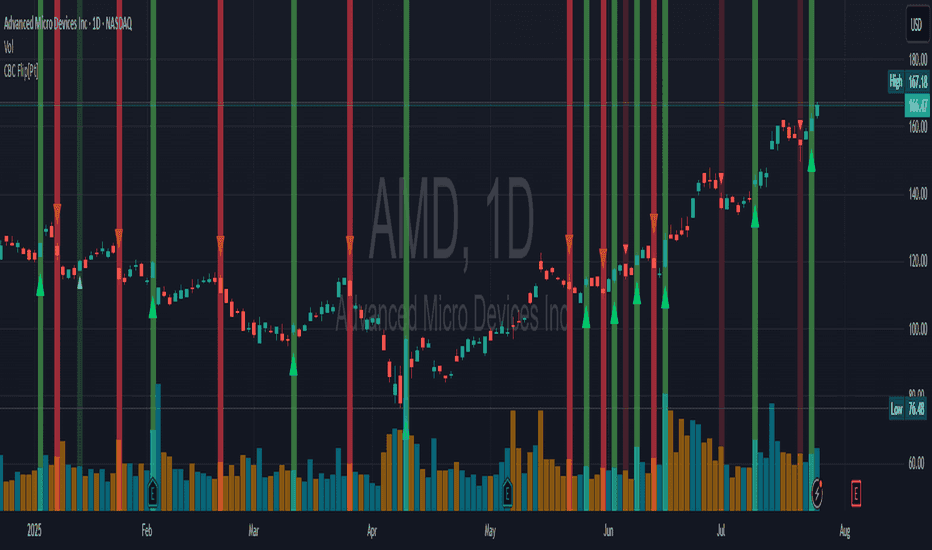
What additional context would make this chart easier to read?
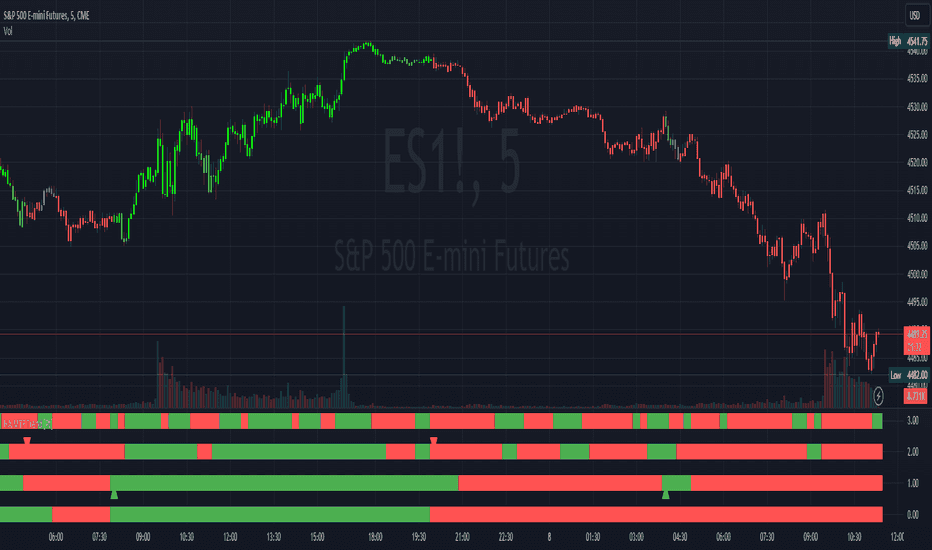
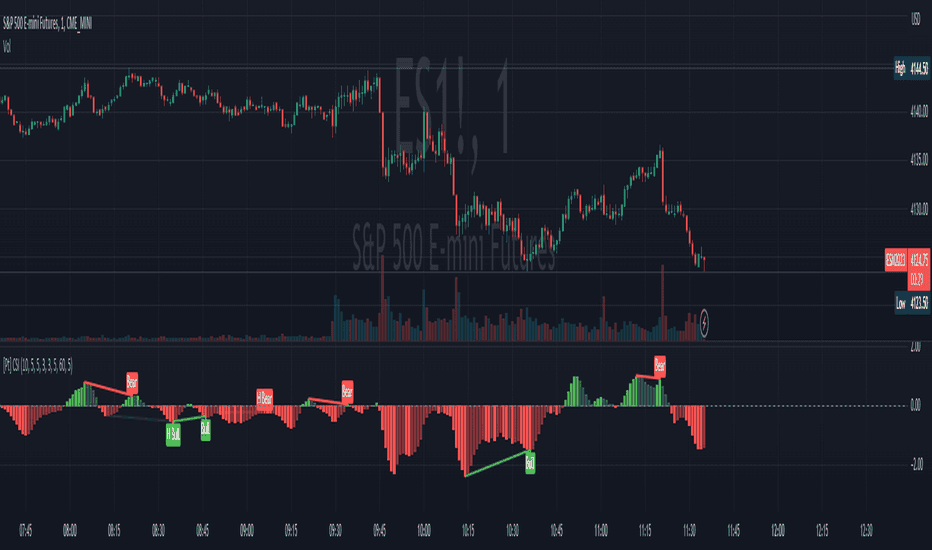
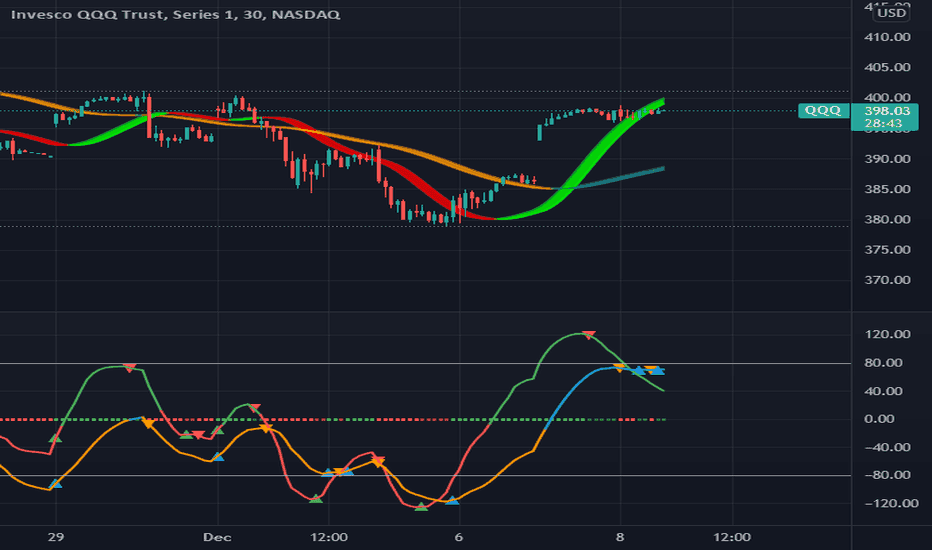
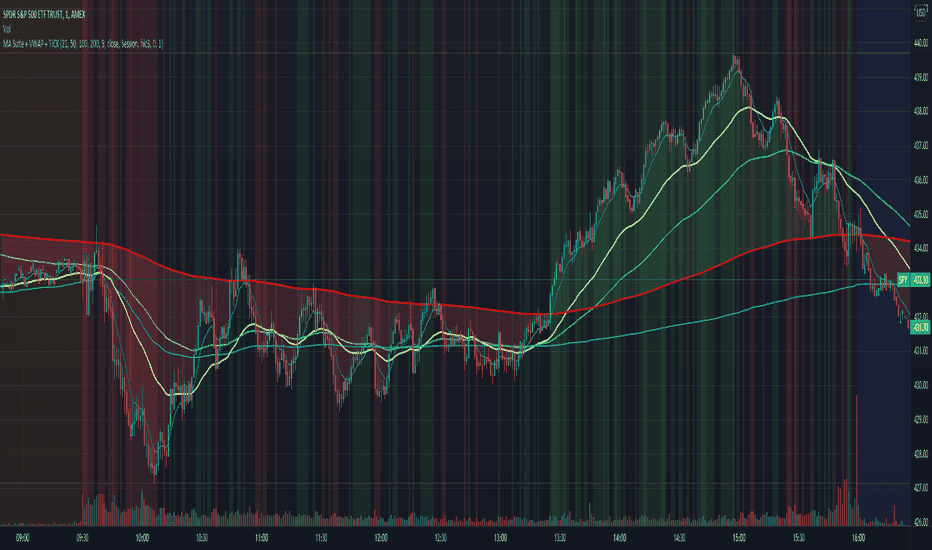
Add moving averages, multi-timeframe candles and focused analytical displays.
Choose the view for your workflow.
Platform-specific tools with their own methods, data requirements and access.