
The story behind PtGambler

From gambling
to understanding.

I started creating trading indicators because I wanted to understand the market for myself.

What began as a personal learning project has grown into tools I now share with other traders.

Follow the journey

Before the indicators

An expensive lesson.
A different approach.

I lost a lot of money trading during the COVID-era market. Looking back, I was treating trading more like gambling than something I truly understood.

That pushed me to learn from the ground up. As an engineer, building indicators felt like a natural place to start. I could turn trading concepts into code, test ideas, and see what was happening behind the signals on my chart.

One question led to another. Small experiments grew into more detailed tools as I explored different parts of the market.

The tools tell the story

A broader view,
one tool at a time.

Each new tool started with something I wanted to understand better. I kept building on earlier ideas as I explored new ones, so these chapters often overlap.

Explore the publication history
  1. 2021–22Chapter 01

    Defining a setup

    Learning to define a trading setup

    MAROC Fast/Slow began with a simple idea: measure how quickly moving averages were changing. I went on to experiment with candle patterns, momentum and moving-average signals.

    Writing a strategy forced me to be specific about entries and exits. Coding gave me a way to test the rules I thought I was following and examine the assumptions behind them.

    Trend and momentum · Entry and exit rules · Testing ideas
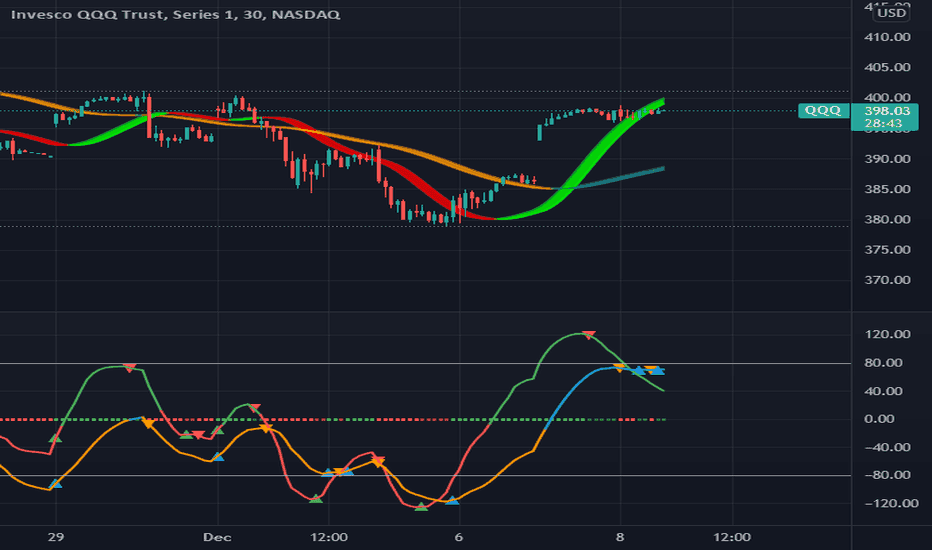
    MAROC Fast/Slow publication chart showing moving-average rate-of-change lines and trend markers.
    MAROC Fast/SlowPublication chart
  2. 2022Chapter 02

    Market participation

    Looking beyond price

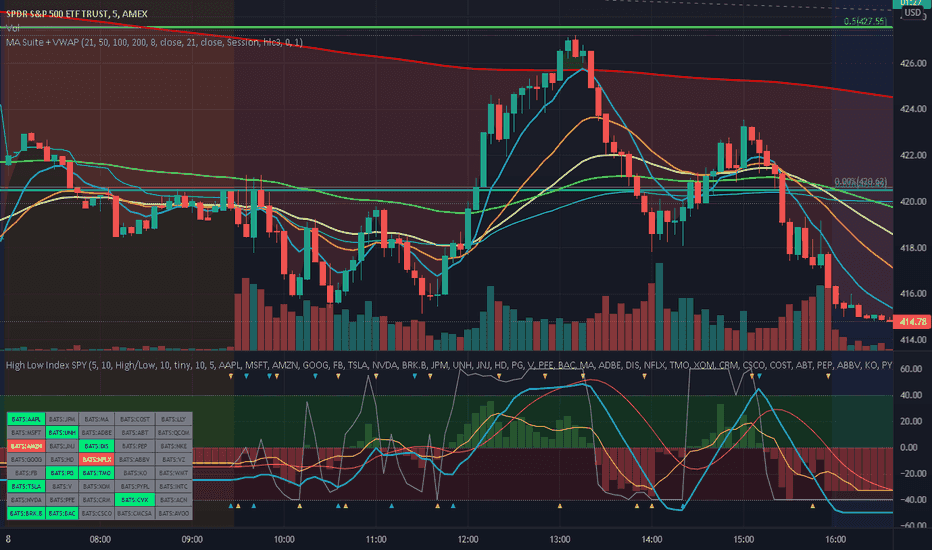
    I started looking at market breadth: how many individual stocks were taking part in a move. High Low Index SPY Top 40 helped me look beneath the index, while TICK indicators compared stocks ticking up with those ticking down.

    NYSE Market Sentiment Oscillator brought several of these measures together. I wanted to see whether a price move had broad support or was happening while participation weakened.

    Market breadth · TICK · Participation behind price

    High Low Index SPY Top 40 publication chart showing the participation of SPY holdings.
    High Low Index SPY Top 40Publication chart
  3. 2022–23Chapter 03

    Value and the auction

    Discovering where value forms

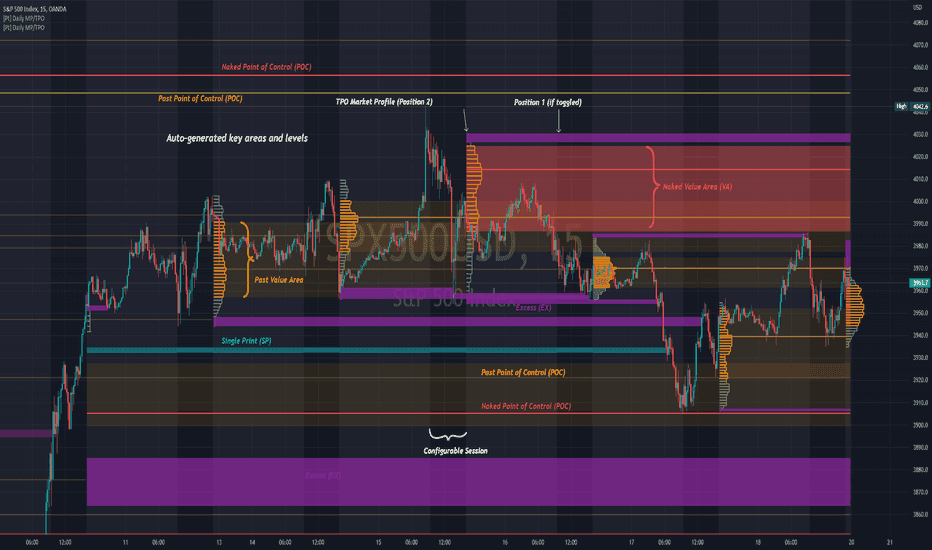
    TPO and volume profiles shifted my attention toward where trading activity was concentrated. TPO tracks time at price; volume profiles track volume at price. Their points of control mark the busiest levels, and value areas show where most of that activity occurred.

    Daily Market Profile / TPO, Opening Range and Initial Balance helped frame the session. Periodic Volume Profile and its later editions let me carry reference levels forward and study how price behaved when it returned to them.

    Time at price · Volume at price · Session reference levels

    Daily Market Profile / TPO publication chart showing time-at-price profiles and auction reference levels.
    Daily Market Profile / TPOPublication chart
  4. 2023Chapter 04

    Pressure and price

    Connecting buying pressure with price

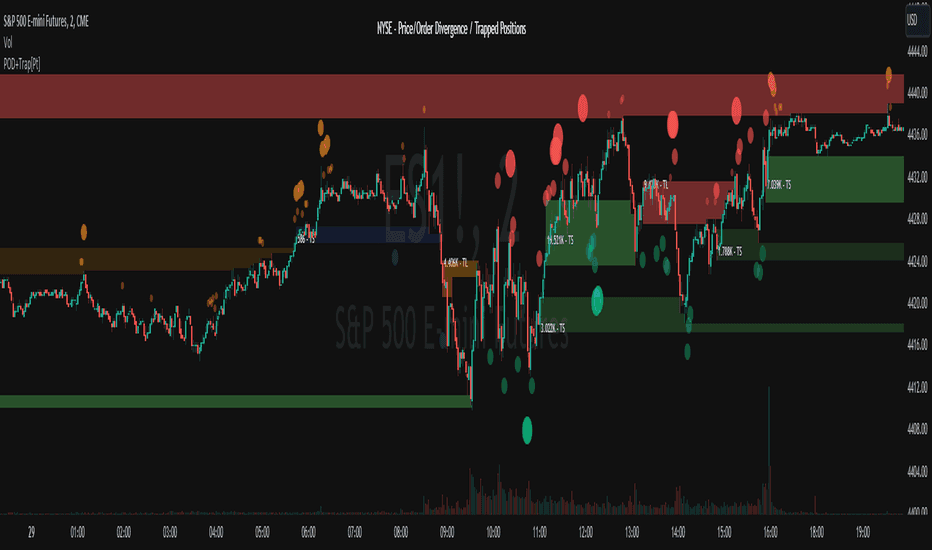
    I became interested in moments when strong buying or selling did not produce the expected price move. Market Order Bubbles and Price Order Divergence use volume and TICK data to estimate pressure and highlight areas where positions may have become trapped.

    These areas gave me a way to study how price responded on a return visit: whether it held, moved through, or stalled. The zones describe a possible market dynamic; they do not identify individual traders or their positions.

    Estimated pressure · Price response · Potential trapped zones

    Market Price Order Divergence publication chart showing divergence bubbles and potential trapped-position zones.
    Market Price Order DivergencePublication chart
  5. 2024–25Chapter 05

    Structure and conditions

    Understanding the bigger picture

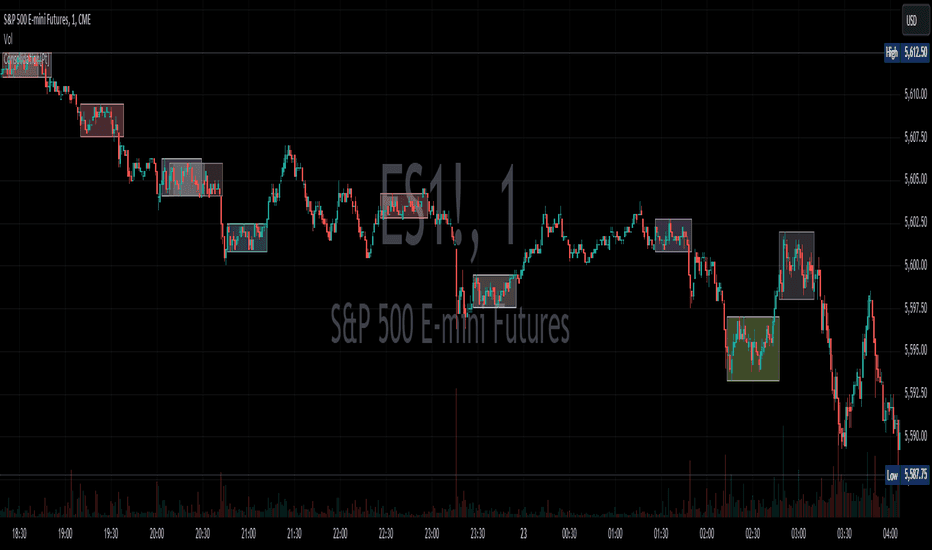
    By this point, I was paying more attention to the conditions around a potential setup. Price Range Volume Profile++ helped separate areas with heavy trading from thinner areas. Consolidation Range Detector focused on periods when price stayed in a range.

    Market Structure MTF Trend added swing highs and lows across timeframes. Together, these tools supported a broader view of balance, directional movement and nearby levels before considering an entry.

    Volume structure · Consolidation · Multiple timeframes

    Consolidation Range Detector publication chart showing detected ranges and subsequent price movement.
    Consolidation Range DetectorPublication chart
  6. 2025–26Chapter 06

    Options and footprint

    Exploring deeper market data

    Two parts of that work continued to develop: options activity across strikes, and the relationship between volume, buying and selling pressure, and price. Both gave me more to investigate using the data available on TradingView.

    Options by strike · Footprint pressure · Data limits

    Best seller

    Options Chart+ [Pt]

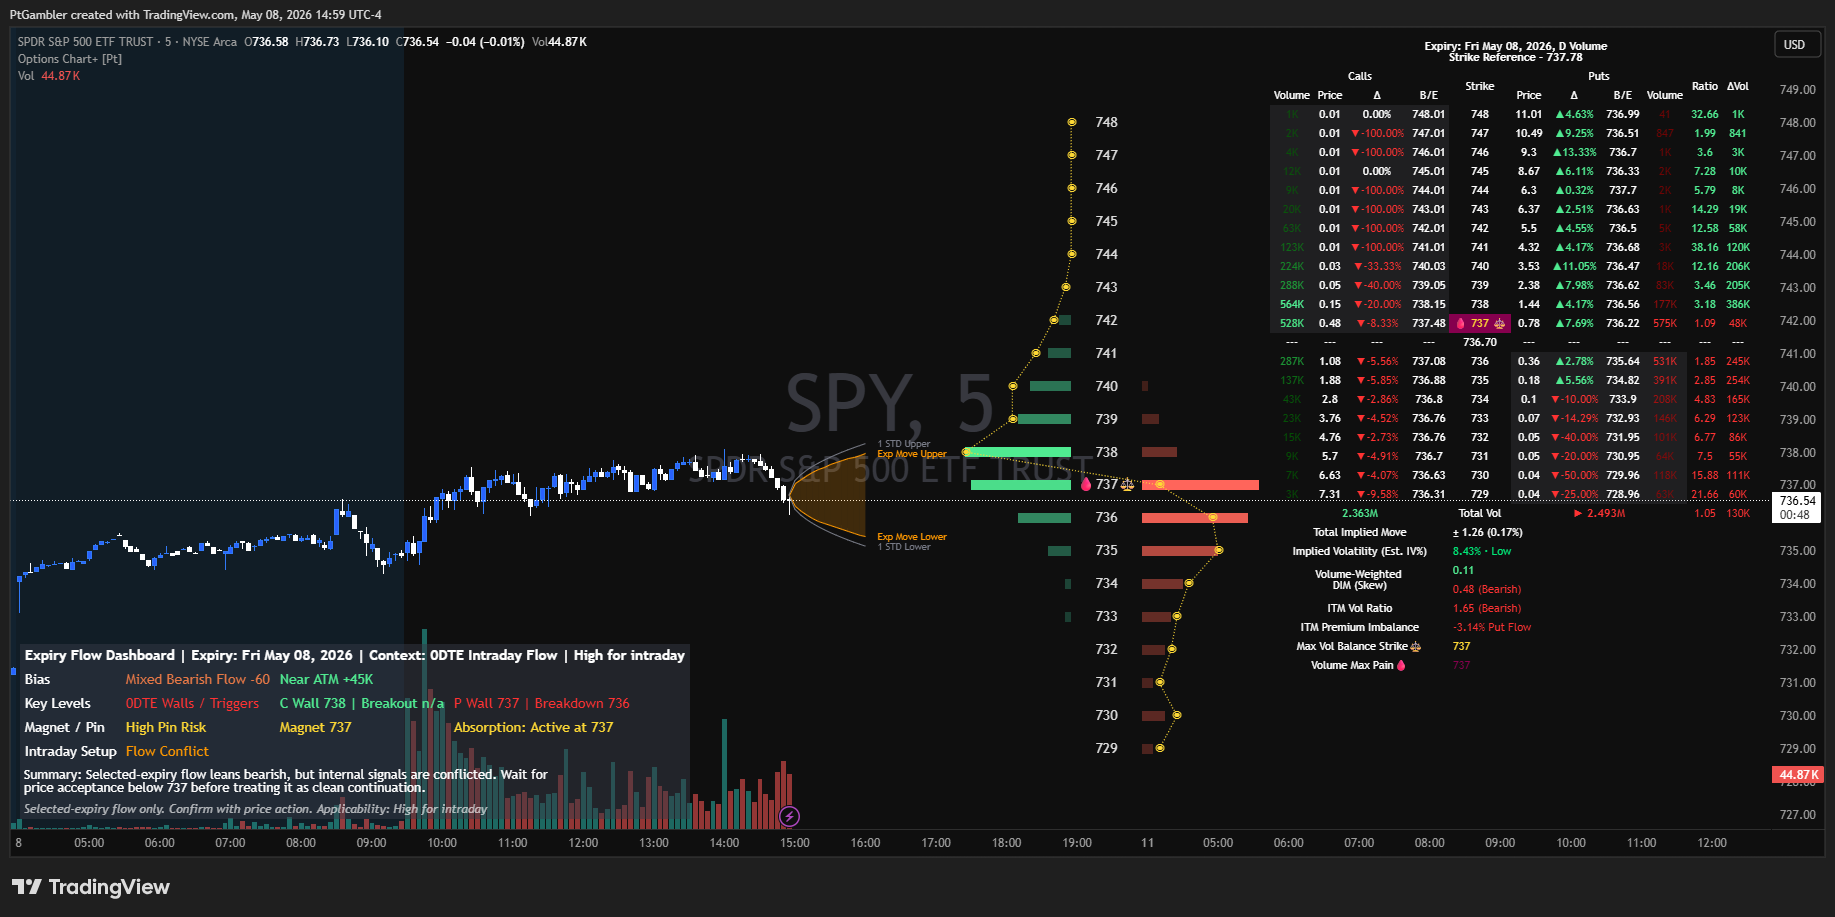
    I wanted a clearer way to relate call and put activity to the underlying chart. Options Chart+ brings prices, volume and strike-level information together, using the selected expiry’s available options data.

    It became my best-selling indicator. Building and refining it has been an important part of how I explore the relationship between options and the underlying market.

    Options Chart+ on a SPY chart, with call and put prices, strike-level volumes and an expiry-flow dashboard.
    Options Chart+ on SPYOpen full-size chart
    Volume and the auction

    PRVP++ with Footprint

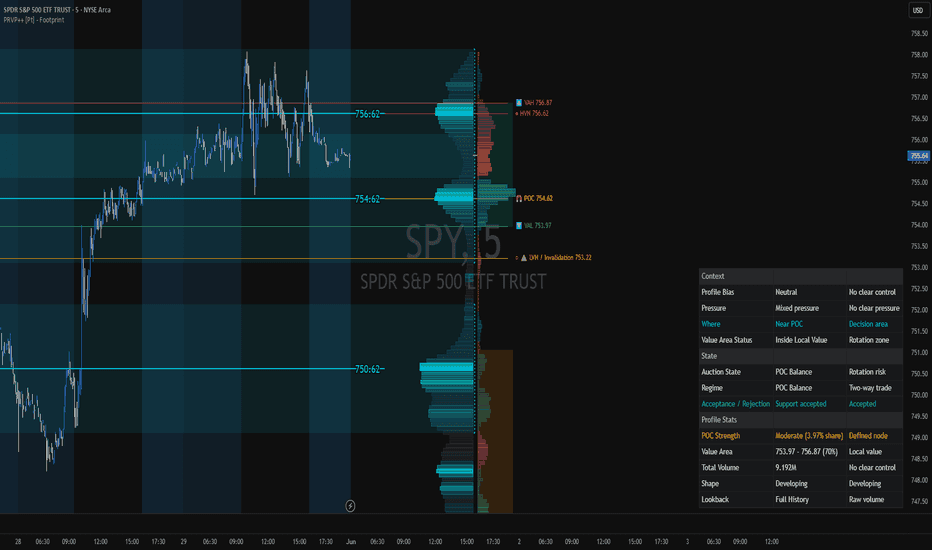
    The footprint edition builds on my earlier volume-profile work. It adds footprint-based buying and selling pressure alongside the main chart-volume profile, where the required data is available. This lets me study where pressure appears and how price responds around value areas.

    Price Range Volume Profile++ with Footprint publication chart showing volume structure, value zones and directional pressure.
    Price Range Volume Profile++ · FootprintPublication chart

    Options Price Mapper [Pt]

    A more recent addition, Options Price Mapper puts option premiums and expiry breakevens beside price. It keeps the essentials visible, while Options Chart+ provides the more detailed analysis.

The work continues.

The approach today

Still learning.
Still building.

My approach has changed a lot since those first experiments. I now build tools for TradingView and TrendSpider, exploring everything from market structure and volume to options activity.

I’m still an independent trader and developer, learning as I go. Each new indicator gives me a reason to investigate something further. I share the results in the hope that other traders will find them useful too.

No indicator can tell us exactly what happens next. My goal is to make what’s happening now a little easier to read.

Keep exploring

Explore the tools I’ve built along the way.

Find indicators for market structure, volume, options and order flow, including free tools to try.

14-day free trial

Try a TradingView tool

Checking your account and trial availability…