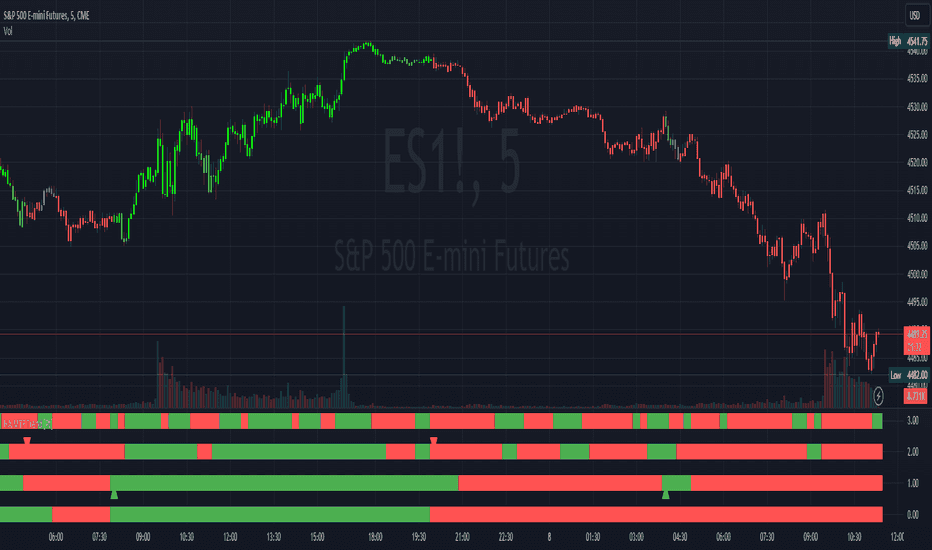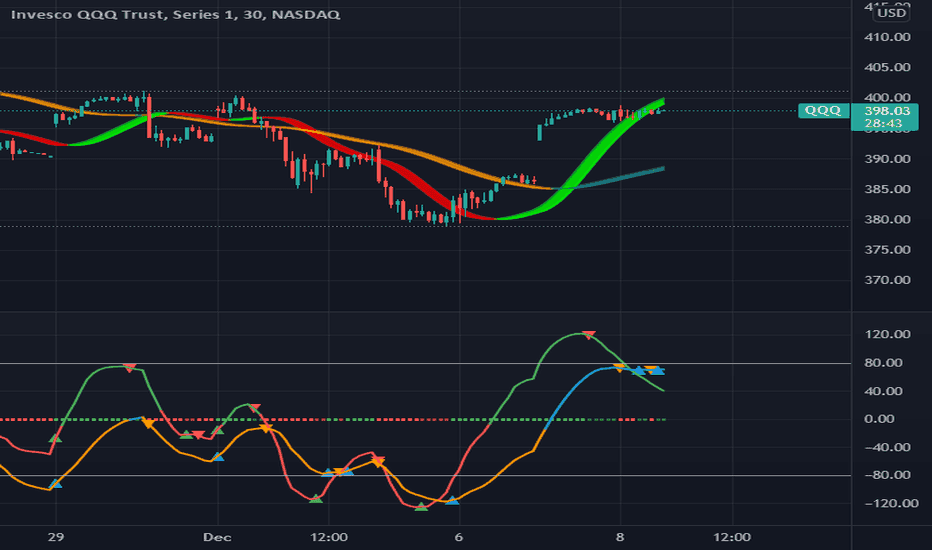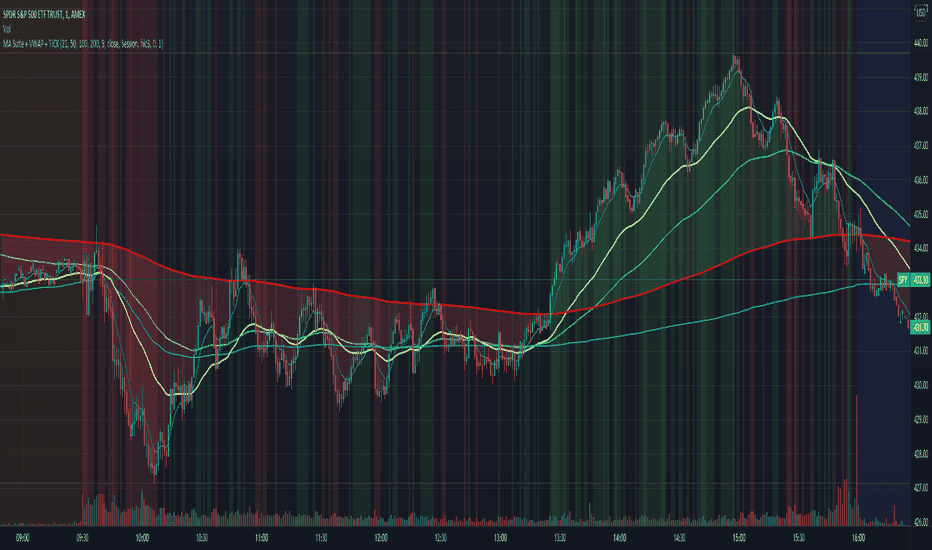

Chart Utilities
TradingView
Candle Strength Indicator
Add candle-strength and divergence context to a chart.
- Candle-strength visualization
- Divergence indicators described in release notes
The analytical question
What additional context would make this chart easier to read?
Visualizes candle strength. Publication release notes also describe divergence indicators; review the source for the current calculation and controls.
Explore the publication and release notesFrom publication to chart
Set up with the right inputs.
Start with TradingView access, then confirm the data and settings for this tool.
Open the linked TradingView publication and review its current requirements.
Add the indicator or strategy to your TradingView chart.
Review the publication and configure the candle-strength display for your chart.
Need help with access or missing data? Visit support.
More on TradingView
Explore the same question.
Compare the differences before adding another tool to your workflow.