
Price Range Volume Profile++ · Footprint
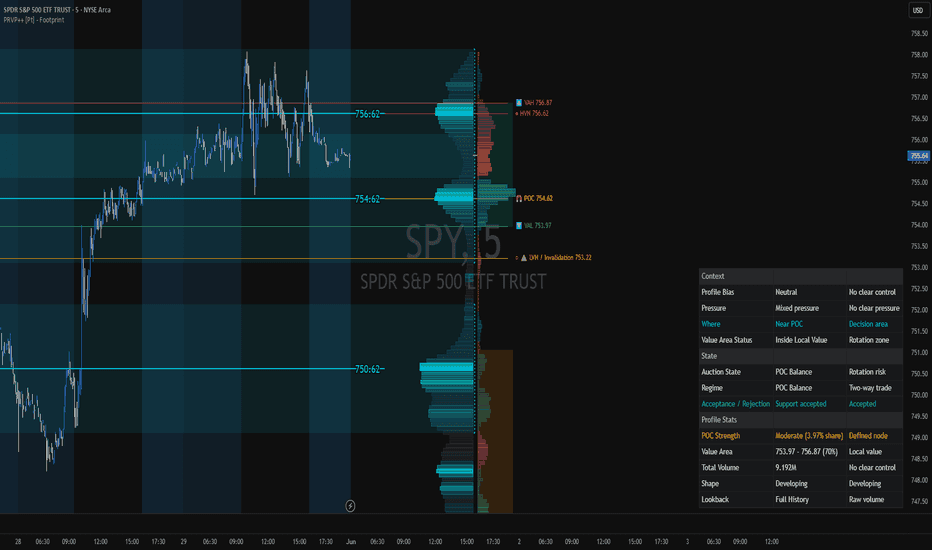
Explore volume nodes with footprint-based directional and auction context.
Request free trial14 days · No payment required
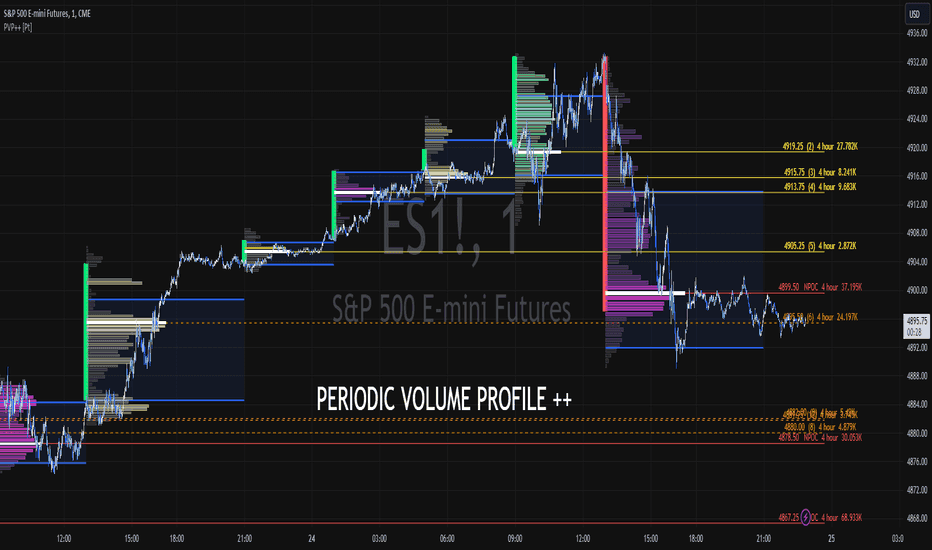
Compare volume distribution and points of control across periods.
The analytical question
Period-based profiles and extended POC lines with touch/cross end conditions; chart-object limits constrain history displayed.
Explore the publication and release notesFrom publication to chart
Start with TradingView access, then confirm the data and settings for this tool.
Open the linked TradingView publication and review its current requirements.
Add the indicator or strategy to your TradingView chart.
Select the profile period and the conditions that end extended POC lines.
Need help with access or missing data? Visit support.
More on TradingView
Compare the differences before adding another tool to your workflow.
Explore volume nodes with footprint-based directional and auction context.
Compare recurring volume profiles with flexible display and POC history.
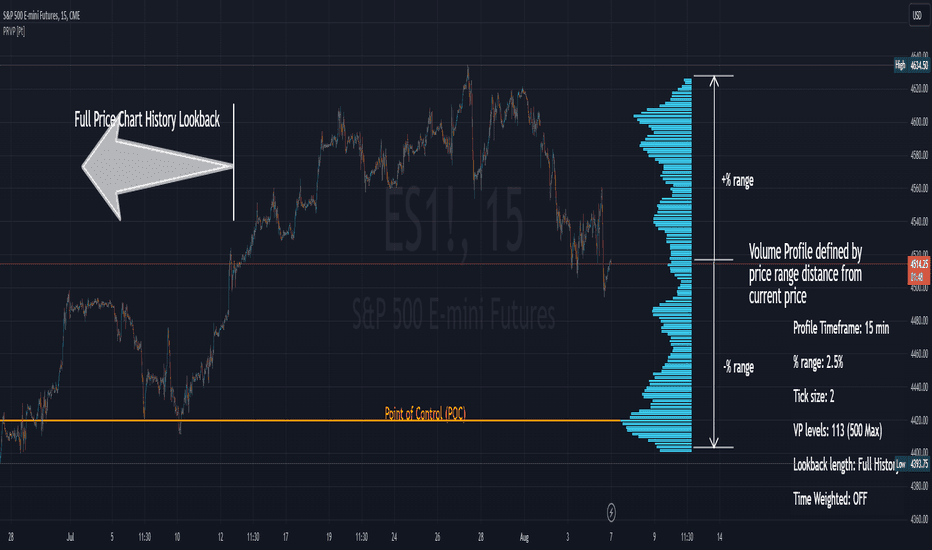
Inspect where volume accumulated within a selected price range.