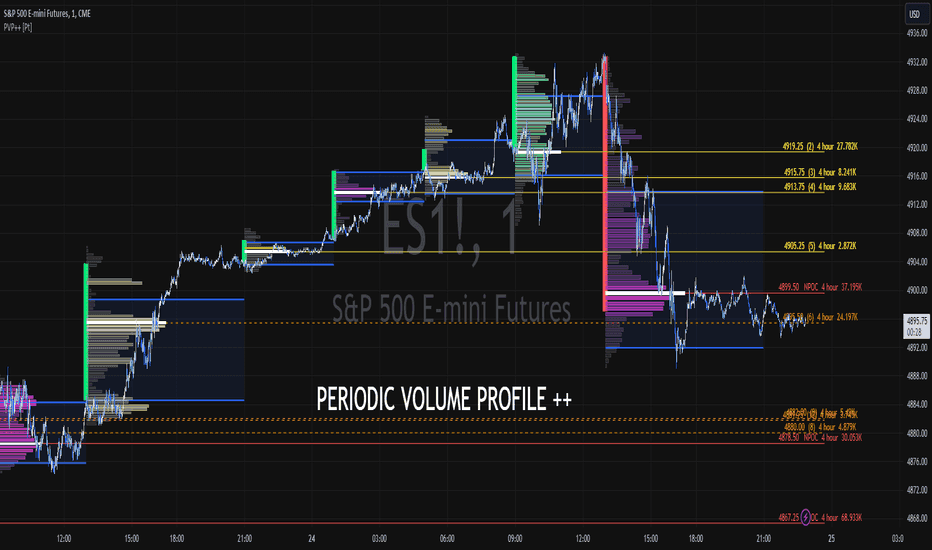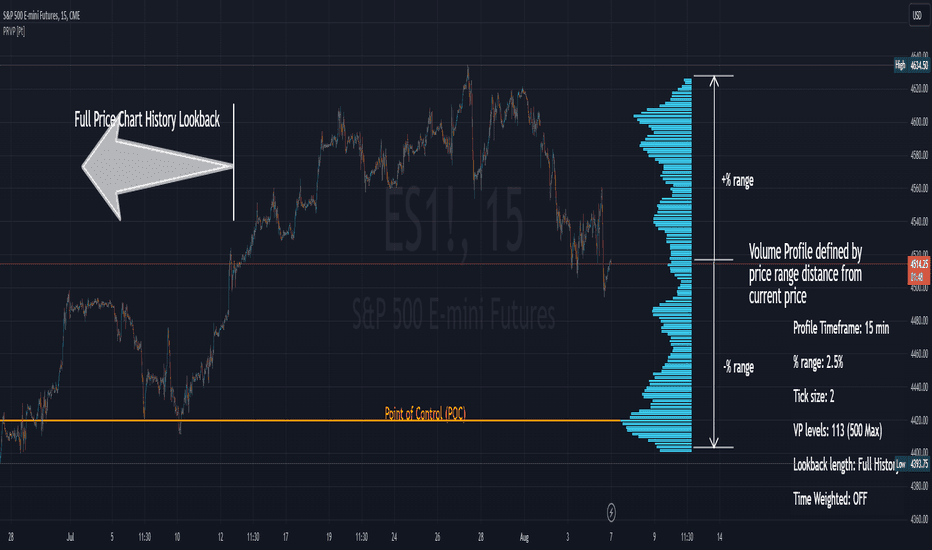

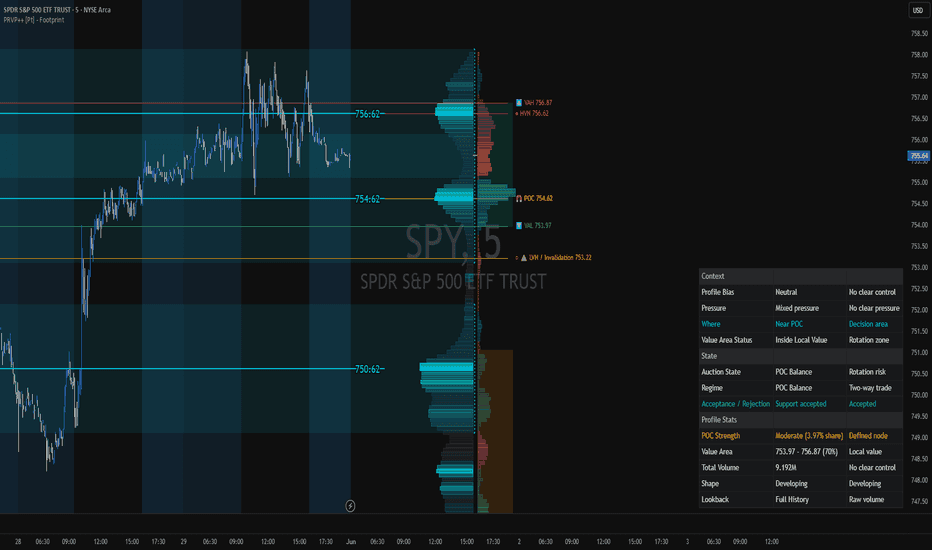
Price Range Volume Profile++ · Footprint
Explore volume nodes with footprint-based directional and auction context.
Request free trial14 days · No payment required
See where price spent time, compare sessions and track the opening range with TPO Market Profile v2.
TPO v2 replaces Daily Market Profile / TPO. Before the official public release, open the private beta below, select Add to favorites, then find it in Indicators → Favorites on your TradingView chart. The Learn guides use v2.
Open TPO v2 on TradingViewThe analytical question
TPO Market Profile v2 groups visits to price into time buckets. Use the point of control and value area to find where activity concentrated, initial balance to mark the opening range, and separate session profiles to compare daytime and overnight trading.
Explore the publication and release notesFrom publication to chart
Start with TradingView access, then confirm the data and settings for this tool.
Sign in to TradingView and open the TPO v2 private beta using the link on this page.
Select Add to favorites on the publication page. On your chart, open Indicators → Favorites and select TPO Market Profile v2.
Set the session hours, timezone, price-row size and time-bucket duration. Follow the TPO v2 Learn guide for a complete example.
Need help with access or missing data? Visit support.
More on TradingView
Compare the differences before adding another tool to your workflow.
Explore volume nodes with footprint-based directional and auction context.
Compare recurring volume profiles with flexible display and POC history.
Inspect where volume accumulated within a selected price range.