

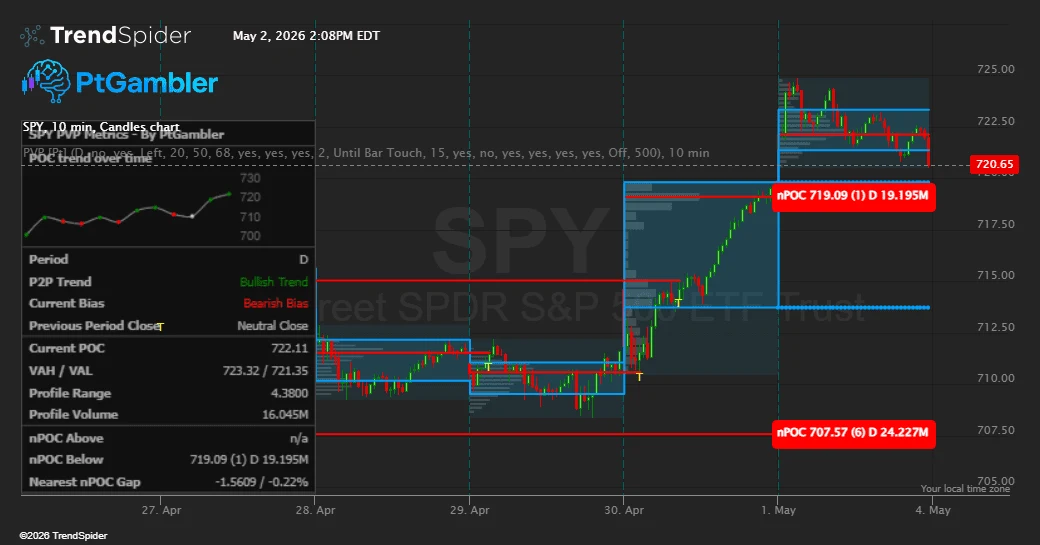
Periodic Volume Profile
Track value migration and developing volume profiles across periods.
Map high- and low-volume zones within a selected lookback.
The analytical question
A selected-lookback volume profile with high- and low-volume zones and an auction-context dashboard. It complements a period-comparison workflow but is a separately subscribed product.
Explore the publication and release notesFrom publication to chart
Start with TrendSpider access, then confirm the data and settings for this tool.
Open the linked TrendSpider marketplace listing and check current account, data and access requirements.
Subscribe or add the free indicator through TrendSpider using the marketplace instructions.
Choose the lookback and review the profile zones and auction-context display.
Need help with access or missing data? Visit support.
More on TrendSpider
Compare the differences before adding another tool to your workflow.
Track value migration and developing volume profiles across periods.