
TICK+
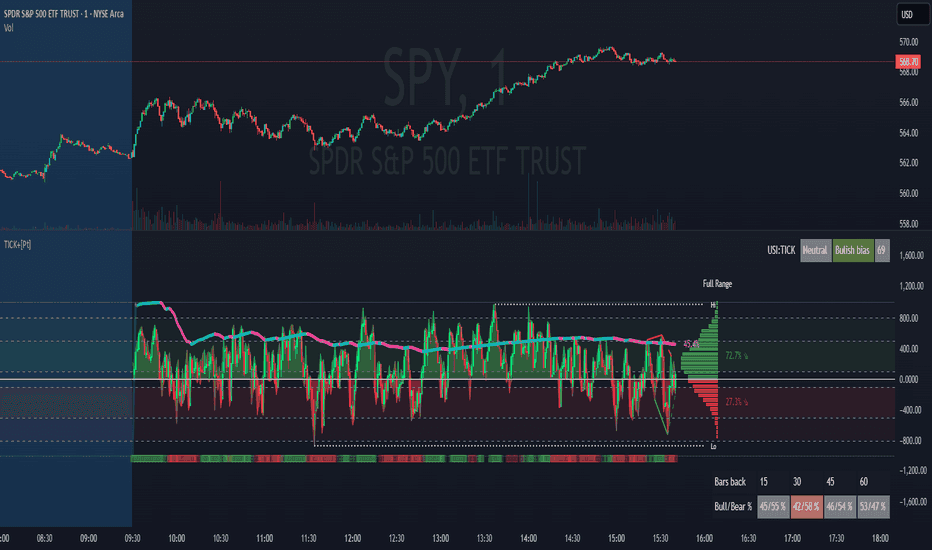
Read market participation through TICK, distributions and divergence.
Request free trial14 days · No payment required
Inspect high/low breadth across a selected top-40 stock universe.
The analytical question
Top-40 modification of LonesomeTheBlue High Low Index; overlaps newer Market Sentiment Index family.
Explore the publication and release notesFrom publication to chart
Start with TradingView access, then confirm the data and settings for this tool.
Open the linked TradingView publication and review its current requirements.
Add the indicator or strategy to your TradingView chart.
Review the stock universe and publication attribution before interpreting the breadth reading.
Need help with access or missing data? Visit support.
More on TradingView
Compare the differences before adding another tool to your workflow.
Read market participation through TICK, distributions and divergence.
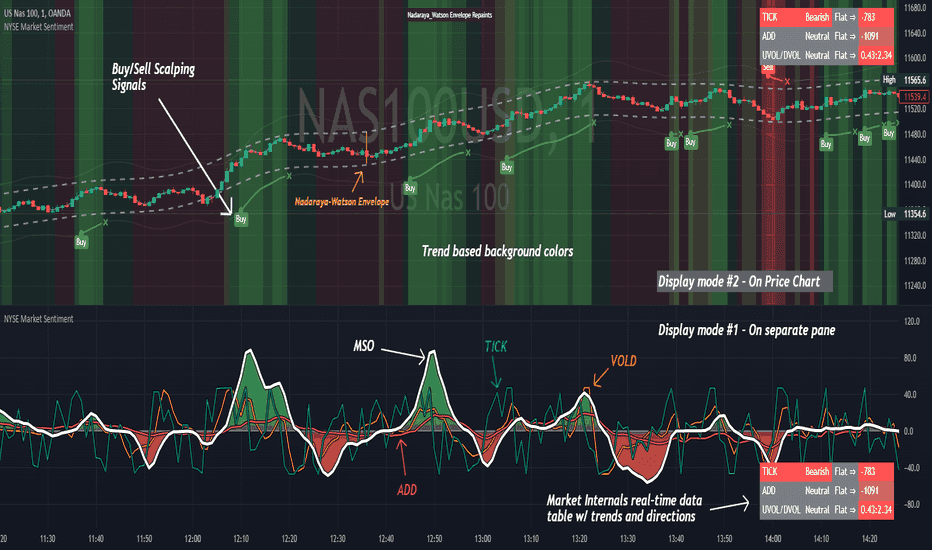
Combine NYSE breadth, volume and cumulative TICK for intraday context.
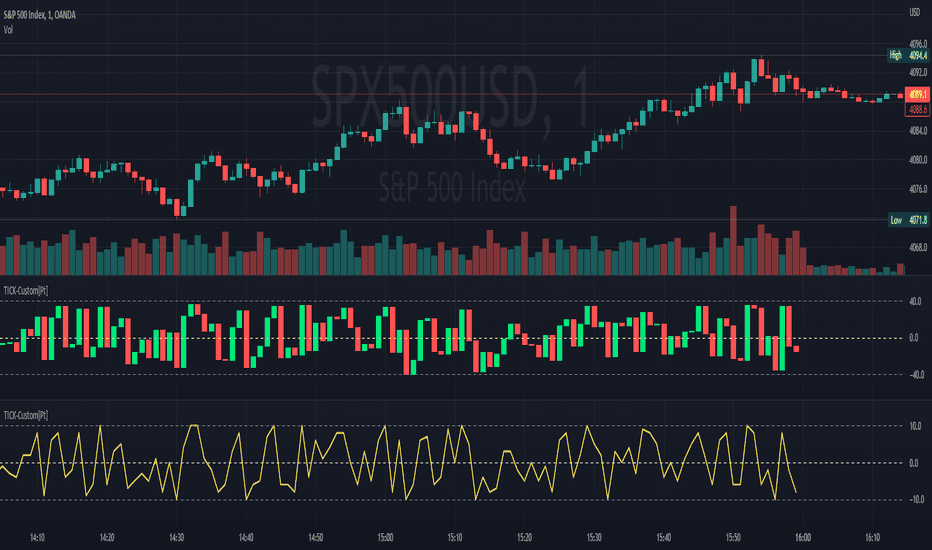
Build a TICK-style participation view for your chosen stock universe.