
Options Chart+
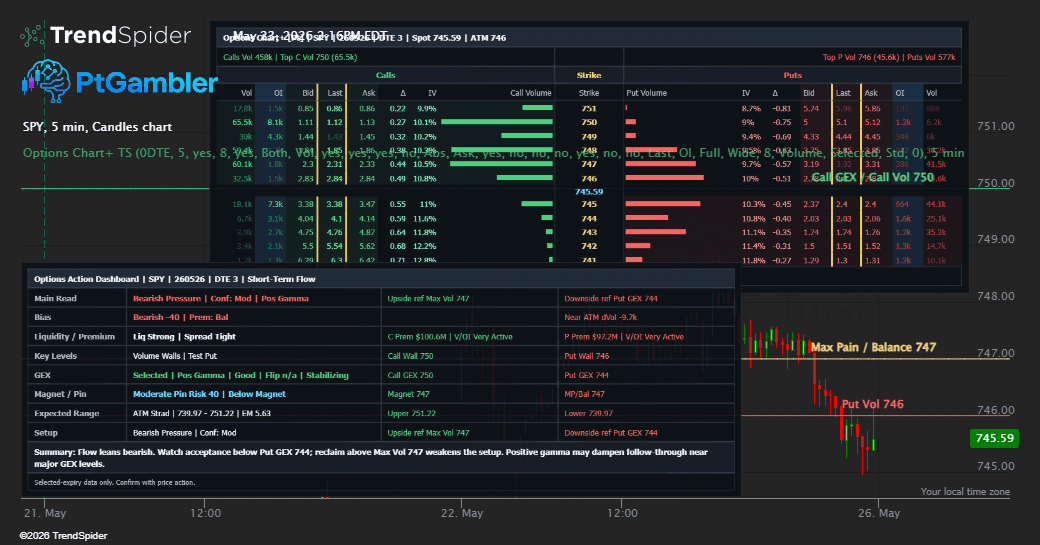
Explore selected-expiry options prices, volume, open interest and modeled exposure.
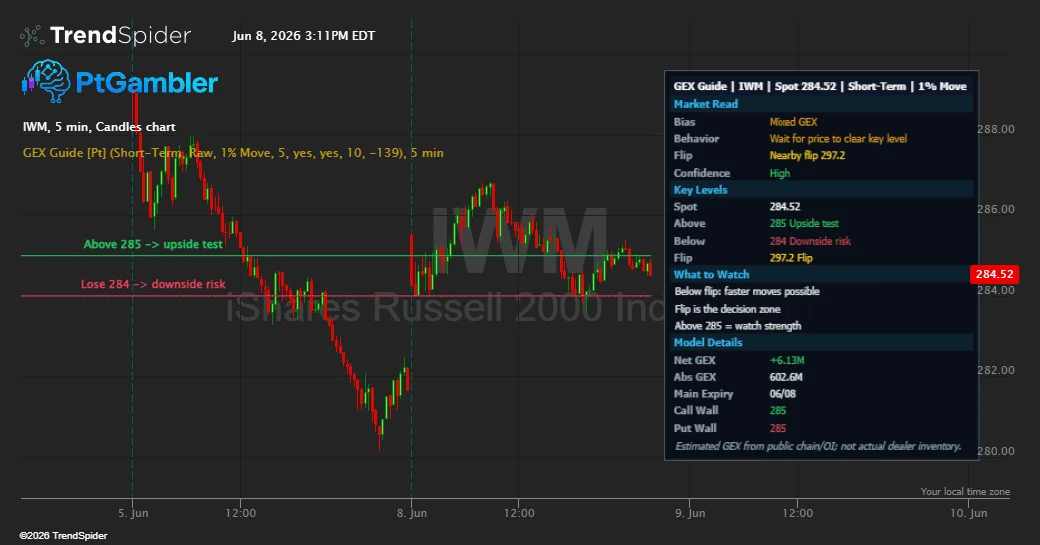
Inspect estimated gamma exposure across multiple expiries and strikes.
The analytical question
A detailed multi-expiry GEX view with a strike ladder, expiry comparison and chart levels. The listing distinguishes its model from actual dealer inventory.
Explore the publication and release notesFrom publication to chart
Start with TrendSpider access, then confirm the data and settings for this tool.
Open the linked TrendSpider marketplace listing and check current account, data and access requirements.
Subscribe or add the free indicator through TrendSpider using the marketplace instructions.
Review the available expiry selections, strike context and chart-level displays.
Need help with access or missing data? Visit support.
More on TrendSpider
Compare the differences before adding another tool to your workflow.
Explore selected-expiry options prices, volume, open interest and modeled exposure.